March 30th, 2025
Improved
reGrowth Platform Update (v0.1.2) - Enhanced Creator Analytics
📊 New Analytics Visualizations
Weekly Posts & Replies Chart

Comprehensive Activity Tracking
Visual breakdown of posts vs. replies over time
Cumulative/non-cumulative toggle for growth trajectory analysis
Interactive tooltips with detailed weekly statistics
Click-through functionality to view specific post details
Advanced Metrics Display
Custom week range formatting for better readability
Dual Y-axis visualization for comparing different activity scales
Responsive design adapting to any screen size
Optimized for both desktop and mobile viewing
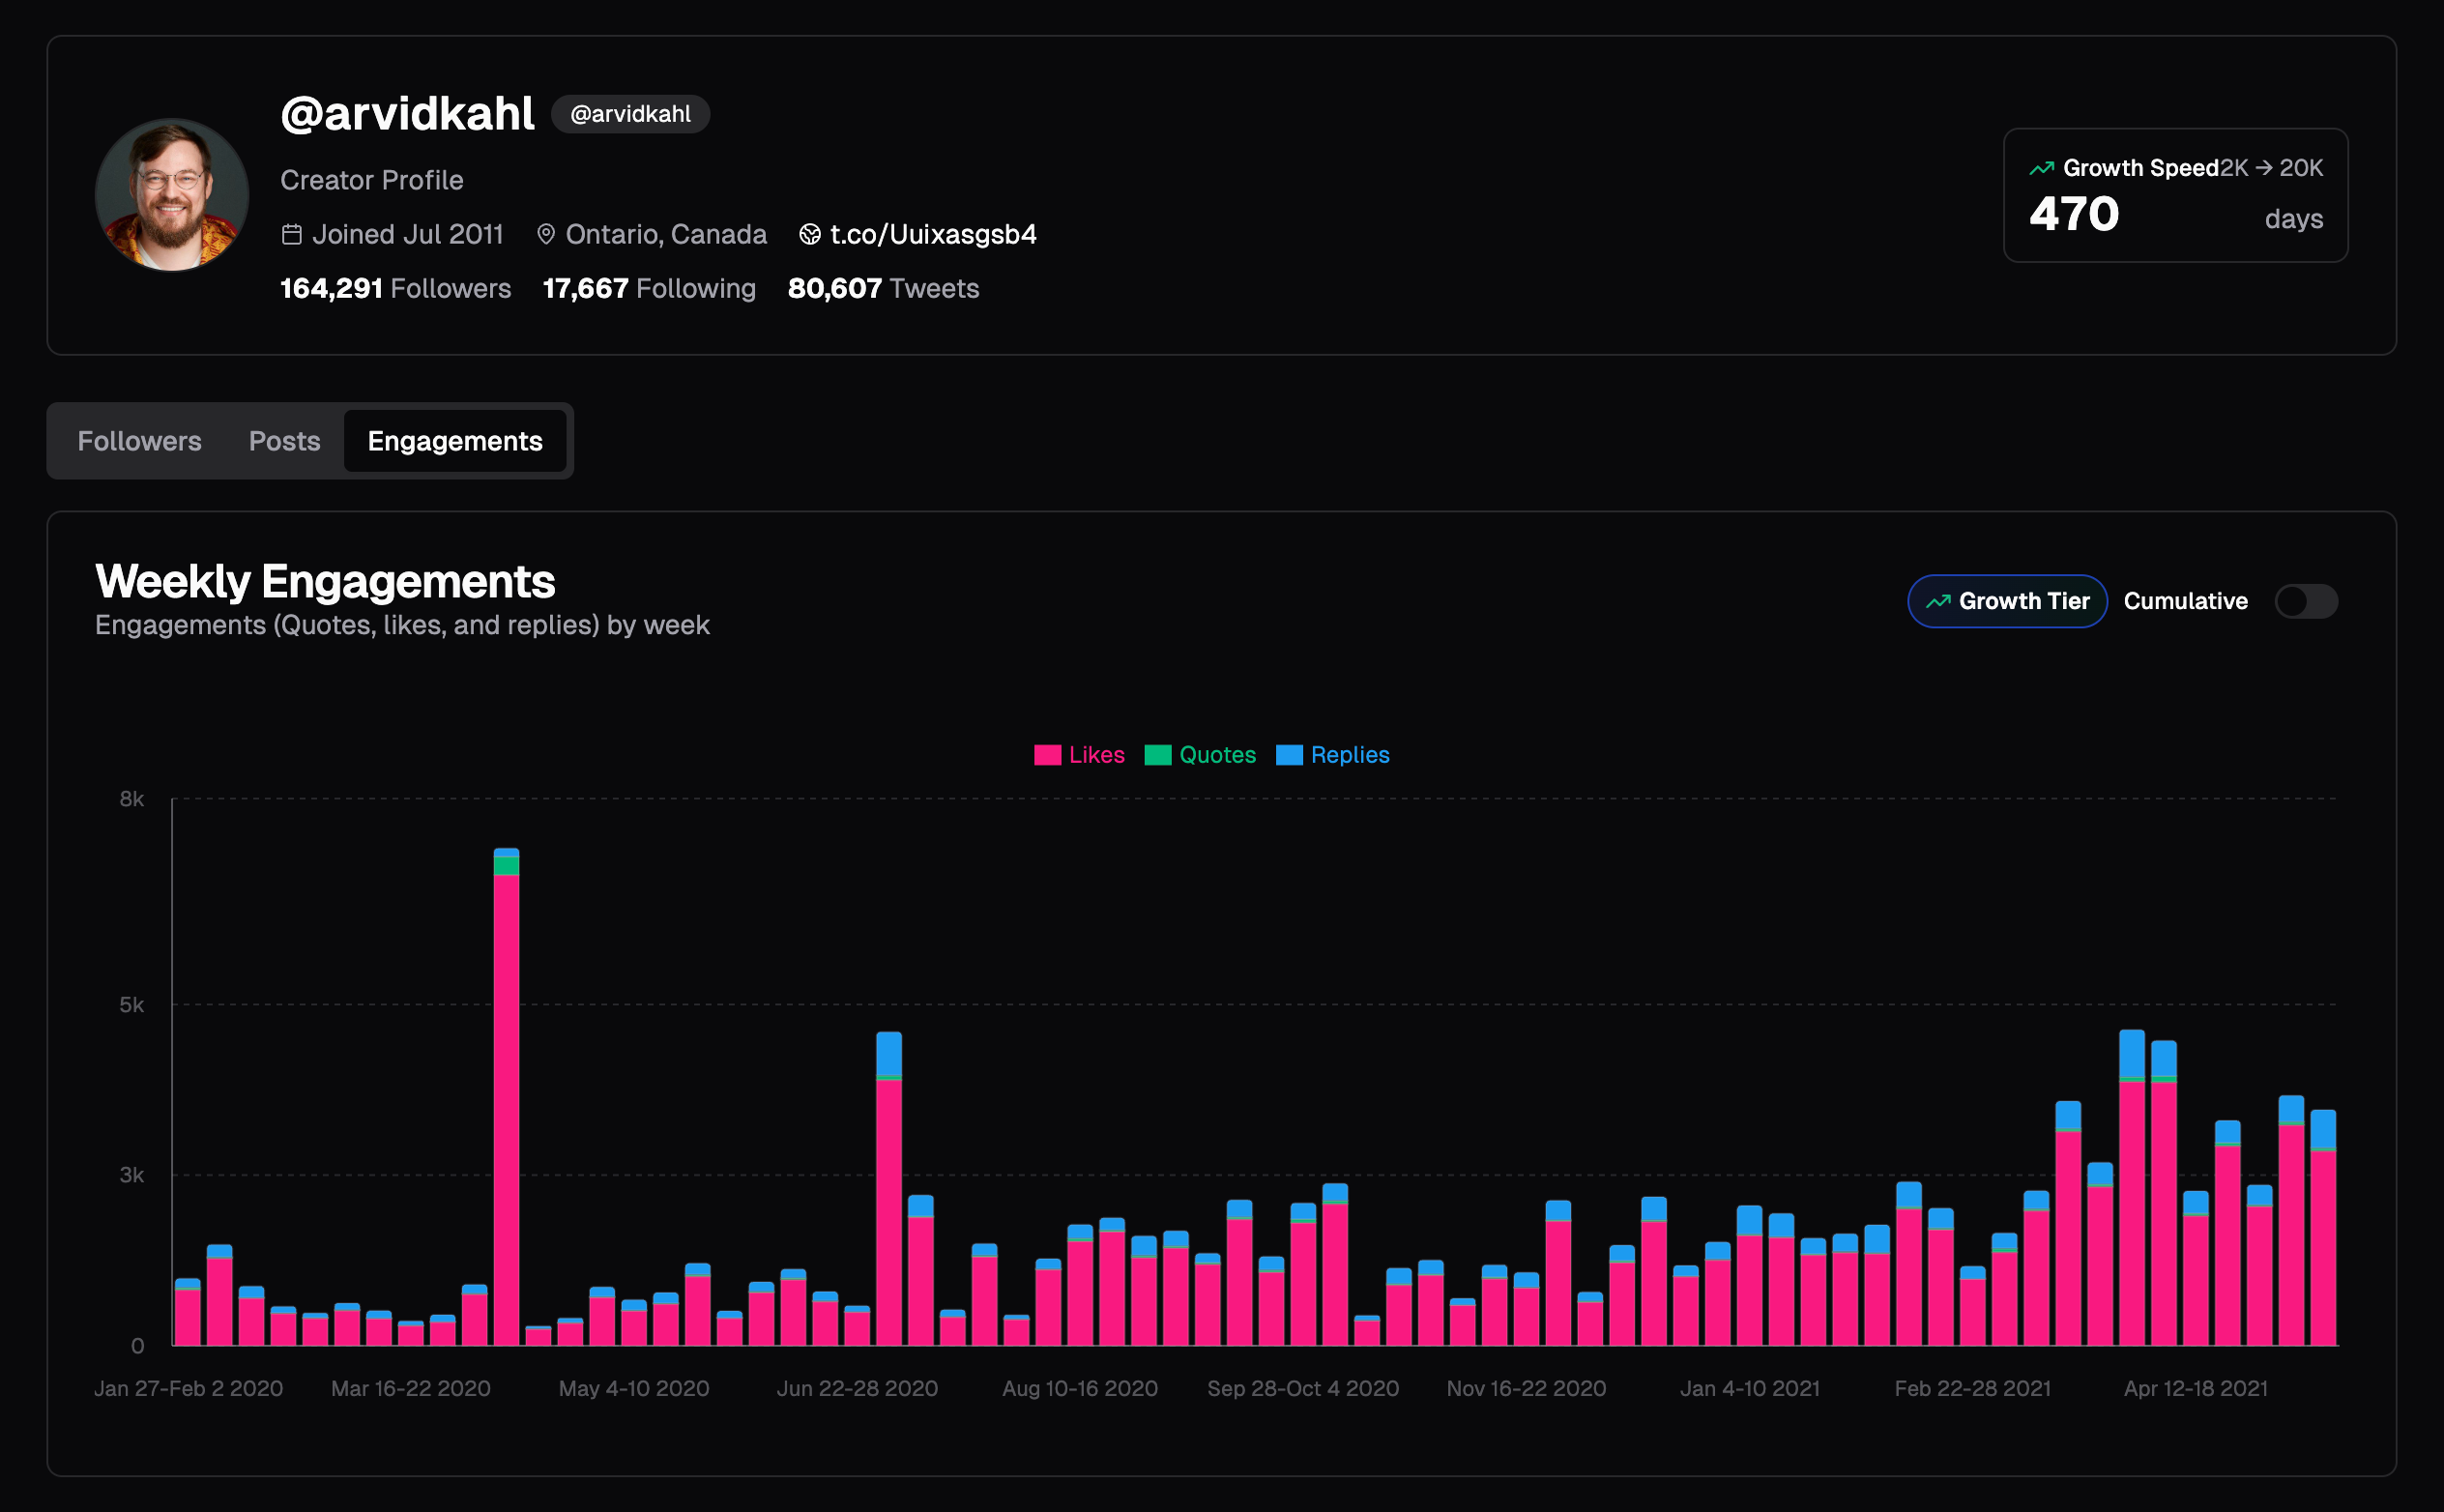
Weekly Engagements Chart

Detailed Engagement Analysis
Stacked visualization of quotes, likes, and replies
Comprehensive engagement breakdown by week
Cumulative view option for tracking total engagement growth
Color-coded metrics for instant visual recognition
Interactive Data Exploration
Click-through charts linked to source content
Contextual tooltips showing precise engagement numbers
Growth tier badge integration
Optimized for meaningful data interpretation
💡 Key Benefits
Deeper Content Insights: Understand which weeks had highest engagement and activity
Pattern Recognition: Identify correlation between posting frequency and engagement
Growth Tracking: Monitor cumulative progress or focus on specific time periods
Content Strategy Optimization: Pinpoint most effective content types and posting patterns
Enhanced Decision Making: Data-driven approach to content strategy and audience growth